Computation: Data Analysis
I have authored several packages for my own data analysis needs in the laboratory.
Image Analysis for Range Expansion Experiments
I developed my own pipeline to process experimental images of growing microbial colonies and extract relevant information. This code was extensively used in a paper I wrote. The pipeline consists of two packages:
The pipeline begins with the range_expansion_image_analysis_fiji repository where I used Fiji, and open-source image processing library, to extract binary masks illustrating where different strains of fluorescent microbes were located in a colony. In the image below, the left was an experiment of mine where multiple colors of E. coli expanded from a dense droplet and segregated into one color locally. The image on the left is experiment, and the image on the right was the masks of each strain created using my script. The words “eYFP”, “eCFP”, and “mCherry” are labels for the strains corresponding to the fluorescent proteins that they produce.

After using Fiji to create the fluorescent masks, I imported the masks into python and developed range_expansion_image_analysis_python to extract relevant information. My code extensively utilizes scikit-image, a standard Python-based image processing library. My Python package could extract various quantities such as the spatial correlation between strains,
the average fraction of each strain vs. colony radius. I utilized the package to compare my experimental results to theoretical predictions.
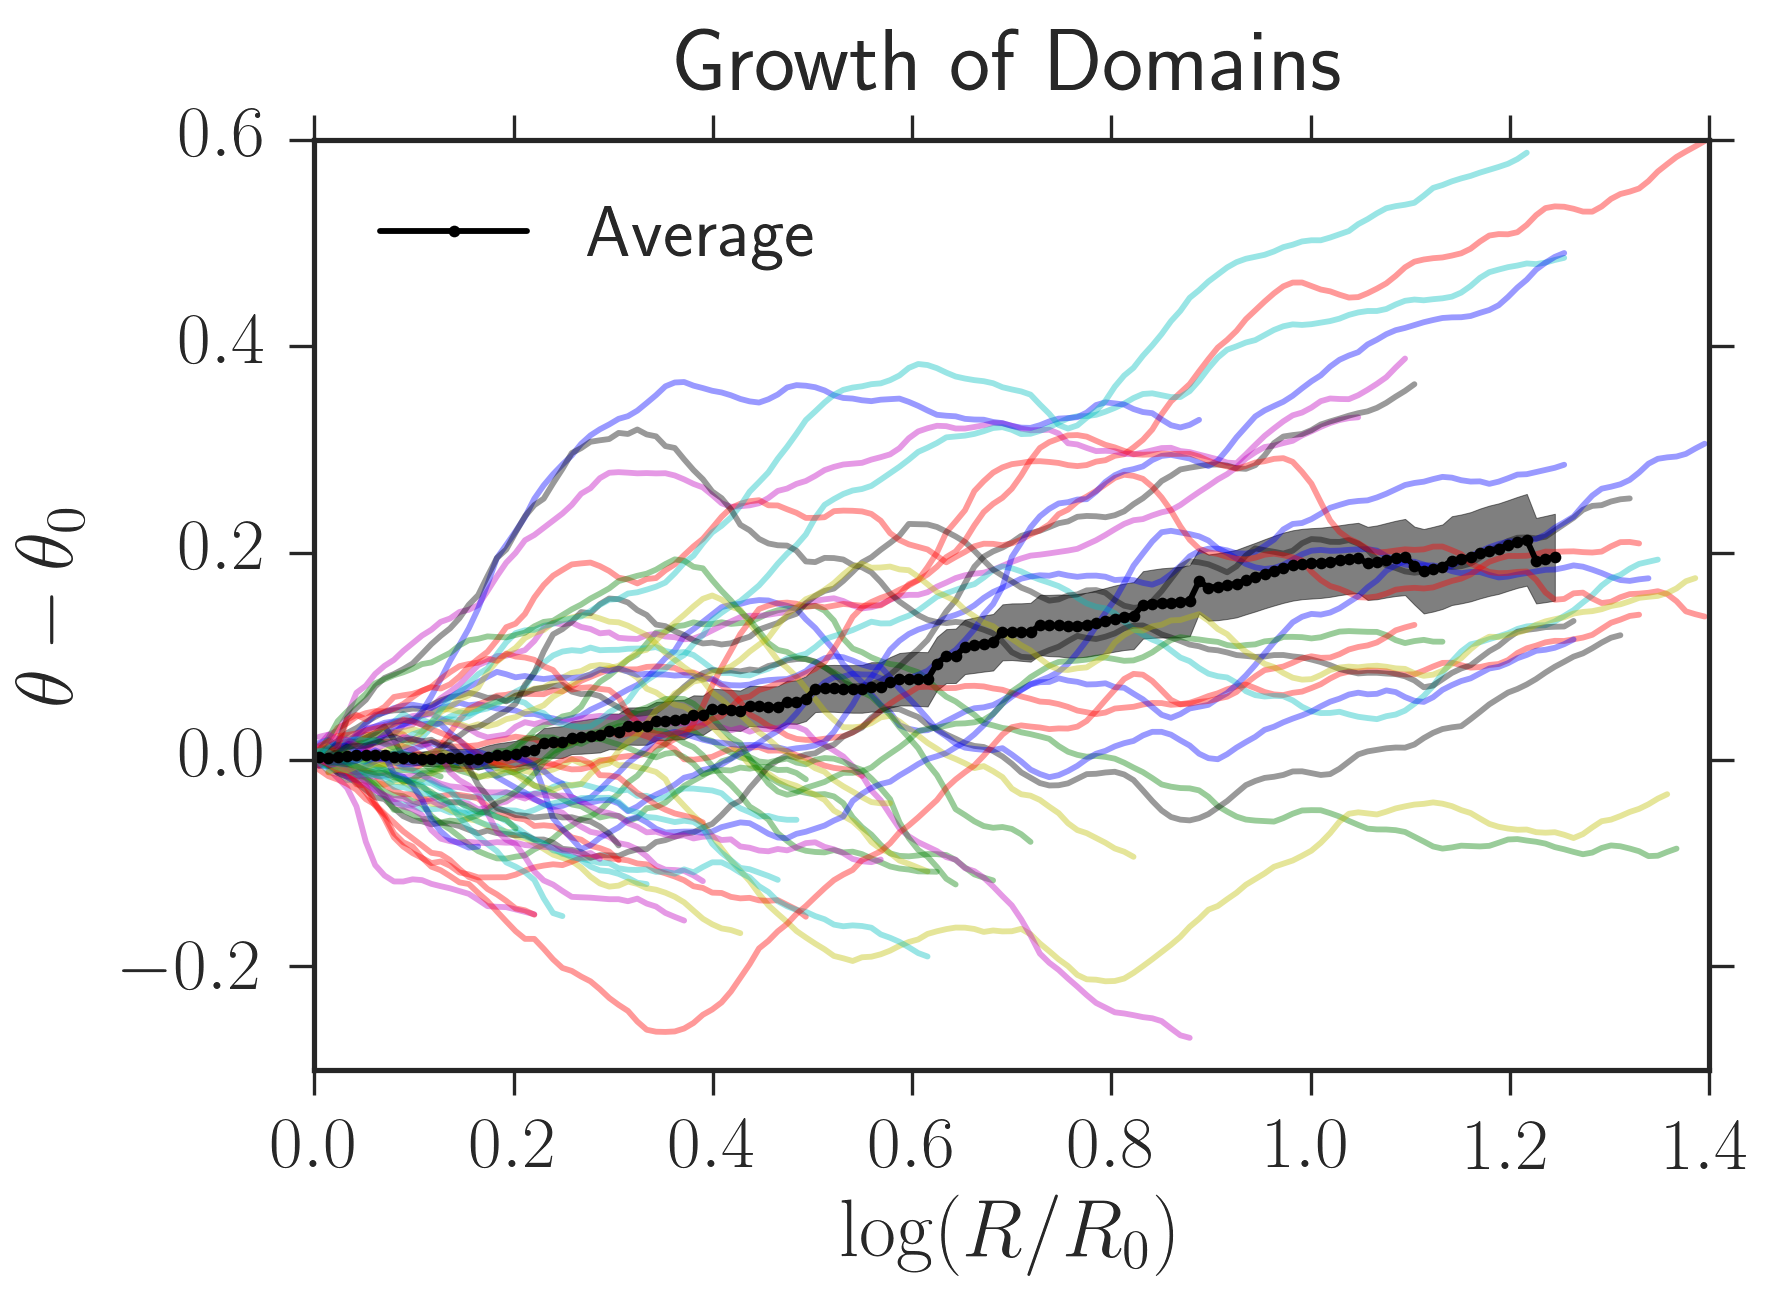
For example, in the linked IPython notebook, I used my package to determine the growth of black sectors from experiments similar to that above; the average angular domain width vs. radius is plotted below.
Many interesting additional plots can be created with the package. For example, I used it to create the figure below illustrating the average fraction of three of the above competing strains (red, yellow, and blue) as a function of colony radius during many experiments. The initial fraction composition is the red dot and the final composition is the blue one. As you can see, the fraction trajectories are very stochastic. In my paper, I developed a theory to predict the statistical properties of this motion. In order to create this plot, I helped to develop python-ternary (I created a new technique to shade ternary diagrams that worked better for my data).

Determining the Growth Rate of Microbes
In order to determine how fast microbes divide (most microbes don’t have sex to reproduce; they just create clones of themselves via “budding”), scientists usually grow microbes in a small glass filled with transparent nutritious media. As the microbes grow, the media becomes “murky” and more opaque. It is thus possible to extract the growth rate of microbes in culture by measuring how much light is absorbed by the media they are growing in vs. time.
My colleague @nwespe and I (Nichole is now an Insight Data Science Fellow!) wrote the Python package OD_growth_finder to extract growth rates of microbes from absorbance data. The package heavily utilized pandas
and numpy, as modern absorbance machines (“Plate Readers”) create tabular output consisting of absorbance information from many simultaneously growing cultures of microbes.
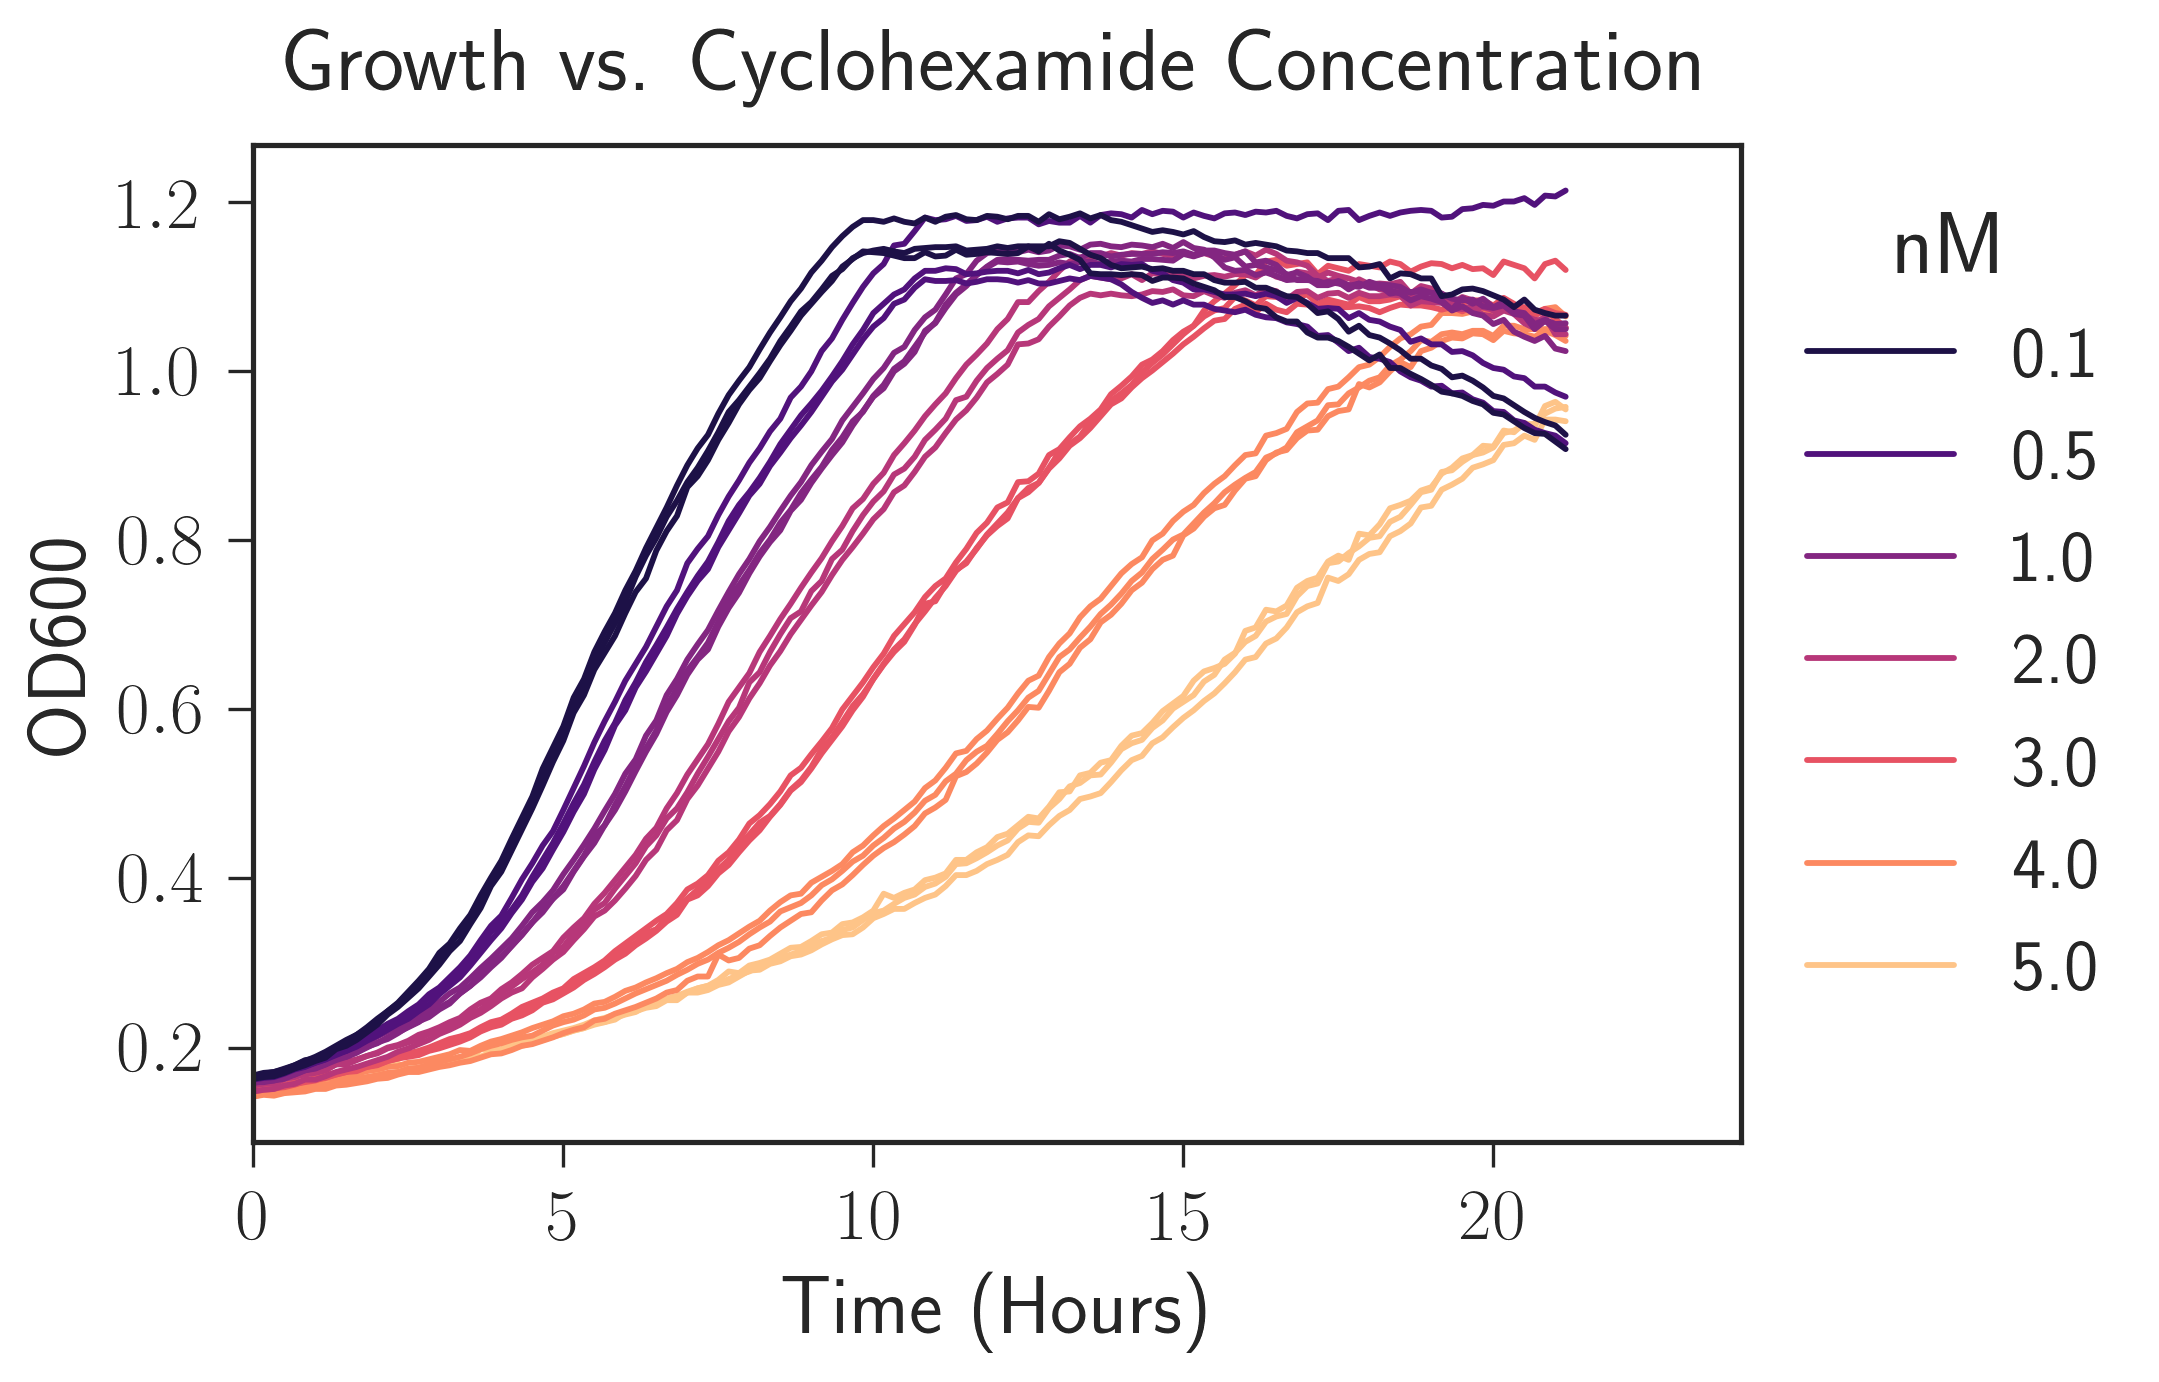
See the linkedIPython Notebook for an idea what the package can do. Below is a plot I created using the package illustrating how adding an antibiotic (cyclohexamide) to a microbial culture will slow their growth and that, unsurprisingly, adding the drug in higher concentration slows their growth more.
Extracting Fluctuation Properties from Time Traces
As a physicist, I am often interested in studying fluctuations around deterministic trends in time-traces. Based on the algorithm discussed in the materials and methods of this paper, I created a cython script that takes a time trace as input and then:
- Creates a window over a given time interval
- Uses linear regression (using the
cython_gslpackage) to fit the deterministic motion of data over the window. - Determines the average mean squared displacement from the linear regression over the window.
- Loop over all possible windows and apply steps 1-3.
This is basically a form of “Detrended Fluctuation Analysis.” See the linked IPython Notebook for an example of how I used the package to extract the superdiffusive behavior of a random walker in one dimension. Below, I show an image of a superdiffusive random walk and a quantification of how it fluctuated vs. window length using my cython package. In practice, I used this package to study how the domain walls separating the different colors in my range expansion experiments fluctuated as the colony grew.

